A data-driven investigation into how extreme events reshape power grid operations, carbon intensity, and energy resilience
Climate change and extreme weather events are fundamentally transforming how our electricity grids operate. Historically, grid operators designed their systems around probabilistic risk models calibrated to relatively rare disruptions—a severe storm here, an equipment failure there—with recovery measured in hours rather than days. But the landscape has shifted dramatically over the past decade as climate-driven hazards accelerate in both frequency and severity. From California's Public Safety Power Shutoffs (PSPS) during wildfire season to winter storms causing cascading grid failures across Texas, hazardous events are no longer rare occurrences—they are becoming the new normal. The 2019 and 2020 PSPS seasons alone cut power to millions of California customers, exposing the fragility of transmission infrastructure in the face of heightened wildfire risk. The February 2021 Texas winter storm underscored that even large, well-resourced grids can face near-total collapse when demand surges and generation failures compound simultaneously. These disruptions force rapid changes in how electricity is generated, transmitted, and consumed, often with significant environmental consequences that are rarely accounted for in real time. Emergency generation—whether from diesel backup systems, fast-ramping gas peakers, or cross-regional power imports—carries a very different carbon footprint than the clean energy resources it displaces. The interplay between reliability imperatives and decarbonization goals creates a tension that grid operators, policymakers, and researchers are only beginning to quantify rigorously. Understanding the intricate relationship between grid resilience and carbon emissions during these critical periods is therefore essential not only for operational excellence, but for building sustainable, reliable energy systems capable of meeting both the immediate needs of communities and the long-term imperatives of climate action.
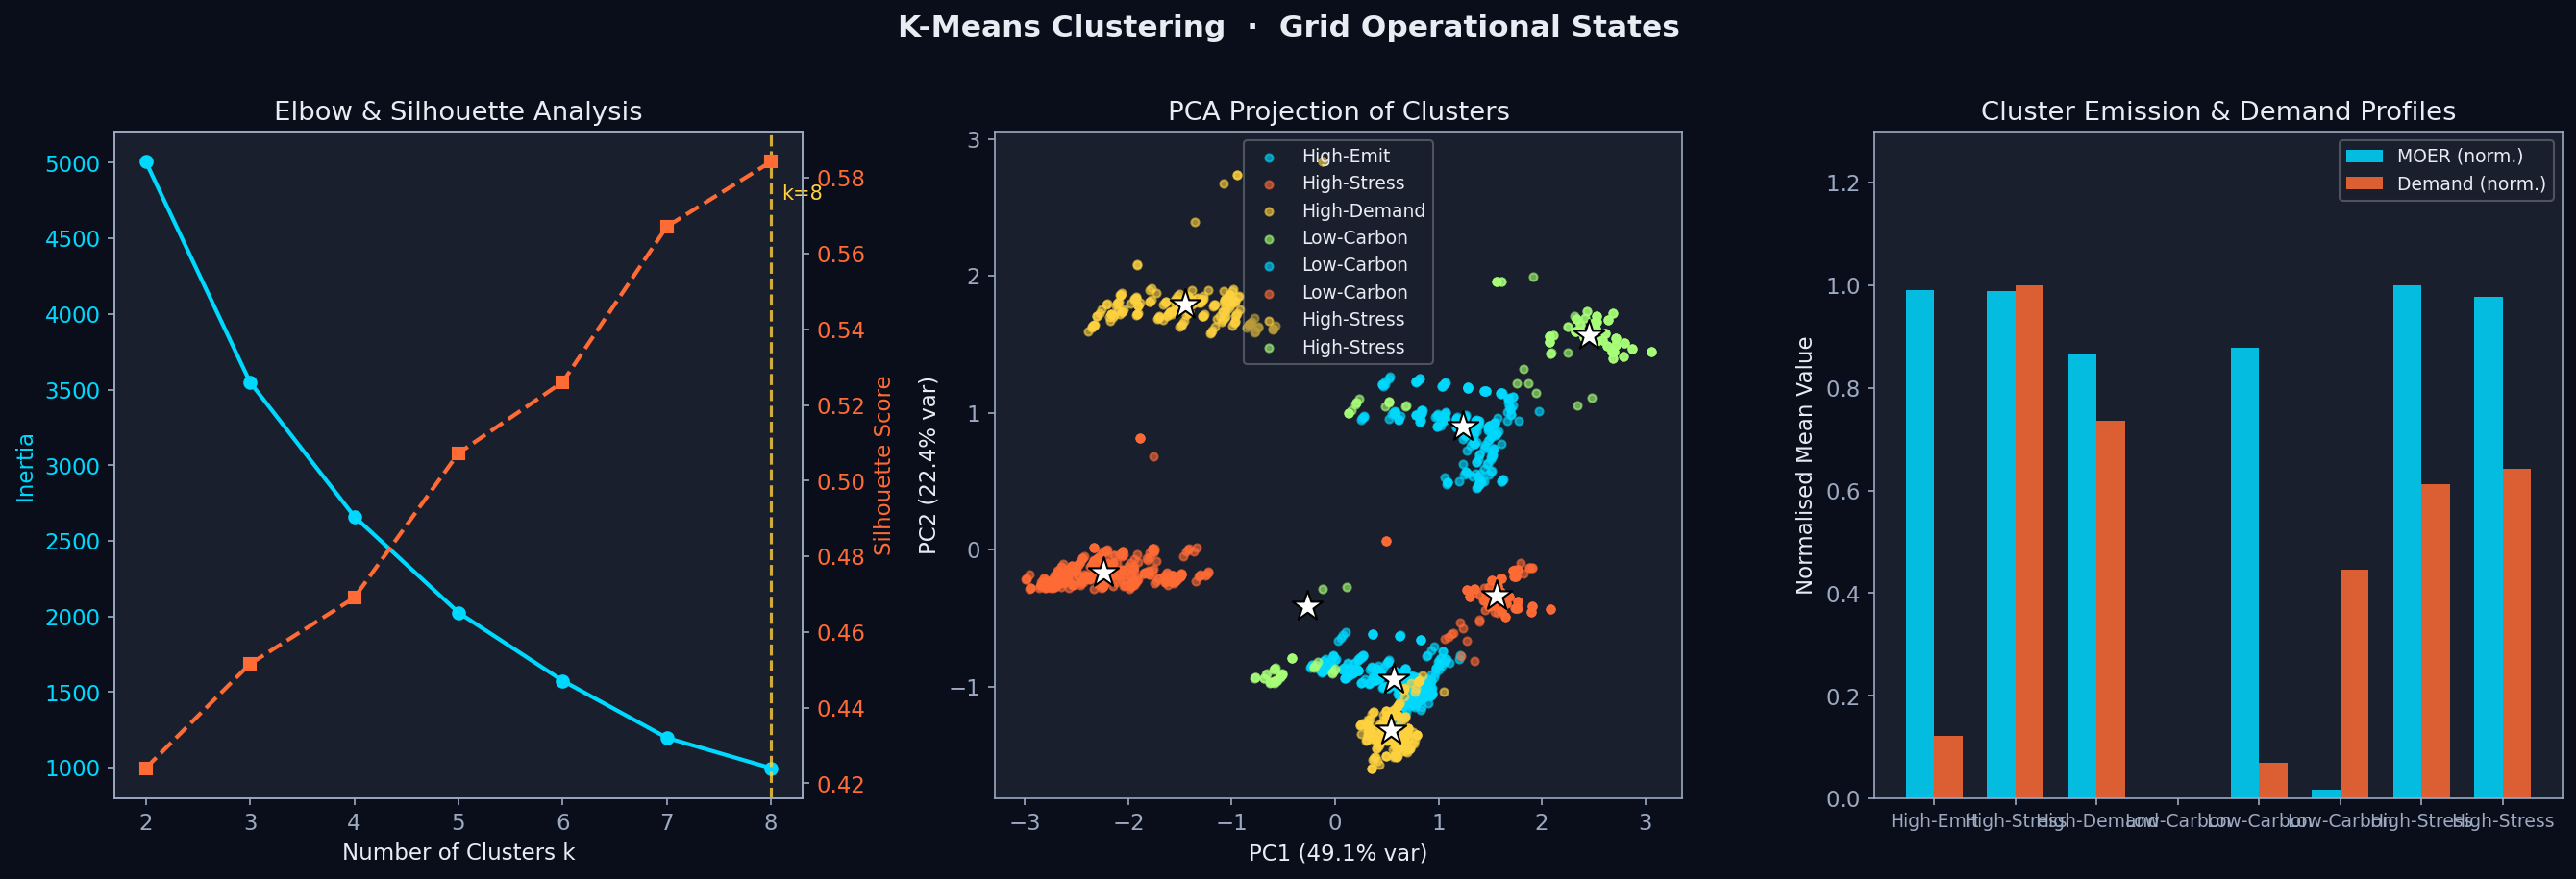
Our research addresses a critical gap in energy systems analysis: how do electricity demand patterns and marginal CO₂ emissions behave during hazardous grid events? While extensive scholarship exists on demand forecasting, load modeling, and emissions accounting, these domains have largely developed in parallel rather than in dialogue with each other. Demand response research focuses on consumer behavior, load flexibility, and grid balancing under normal operating conditions, typically treating emissions as an external variable rather than a coupled system state. Emissions analysis tools like WattTime and ElectricityMap have greatly advanced real-time carbon accounting, yet they are rarely deployed in the context of grid emergencies where the relationships between generation dispatch and consumption are most dynamic and consequential. Few studies systematically characterize both demand and emissions dimensions simultaneously across multiple event types and grid regions. This project leverages high-resolution time-series data from the WattTime API and EIA-930 datasets to reveal the dynamic interplay between grid stress and environmental impact. By analyzing events such as PSPS incidents, extreme weather alerts, and equipment failures, we aim to identify distinct operational signatures—patterns of demand deviation and emissions response—that recur across similar event types. These signatures, once characterized, can serve as templates for forecasting the environmental consequences of future events before they unfold. Our analytical pipeline integrates event detection, baseline construction, feature engineering, and unsupervised clustering into a unified framework that can be applied to new regions and new event categories as the grid continues to evolve. Ultimately, this research provides both a methodological contribution—a replicable approach to coupled demand-emissions event analysis—and a substantive contribution: empirical evidence about how hazardous events reshape the environmental profile of electricity supply.
This research matters because electricity systems are at the intersection of climate adaptation and climate mitigation. When hazardous events strike, grid operators must make consequential decisions within minutes—decisions that balance the immediate imperative of maintaining reliability against the longer-term imperative of minimizing carbon emissions. Utilities facing a sudden surge in demand during an extreme heat event may activate fast-ramping natural gas peakers that are significantly more carbon-intensive than the renewable resources they supplement. During PSPS events, the proactive de-energization of transmission lines to prevent wildfire ignition creates complex localized demand shifts as affected customers relocate or deploy backup generation. These decisions happen in real time with incomplete information, yet their environmental consequences persist for hours or days and ultimately accumulate into the total emissions profile of the grid. The carbon cost of grid emergencies is rarely reported transparently, partly because standard emissions accounting frameworks were not designed to capture event-driven dynamics at fine temporal resolution. By quantifying how demand shifts and emissions spike during crisis moments, we provide actionable intelligence for utilities, policymakers, and grid operators who must navigate these trade-offs under time pressure. Our findings will also inform pre-event planning, enabling utilities to pre-position lower-emission resources and to design emergency protocols that maintain reliability without unnecessarily sacrificing decarbonization goals. More broadly, documenting the emissions cost of hazardous events provides an evidence base for investment decisions—demonstrating the value of grid infrastructure improvements, distributed clean energy resources, and demand-side flexibility that can reduce both reliability risk and carbon exposure simultaneously. The research thus connects the disciplines of grid resilience engineering and climate science, providing a bridge between the operational world of utility control rooms and the policy world of emissions regulation and climate commitments.
The beneficiaries of this research span multiple stakeholder groups with distinct needs and decision-making contexts. Electric utilities gain insights into how their operational decisions during emergencies affect carbon footprints, enabling them to develop lower-emission contingency plans that can be submitted to regulators as evidence of responsible environmental stewardship. Investor-owned utilities facing increasing scrutiny from shareholders and ESG rating agencies have particular incentives to quantify and reduce event-driven emissions, making our methodology directly valuable for sustainability reporting. Grid operators can use our event characterizations to improve forecasting models, enabling better pre-positioning of generation resources before anticipated hazardous events. Emergency response protocols can be refined with explicit consideration of emissions trade-offs, moving beyond purely reliability-focused planning to more holistic operational frameworks. Sustainability officers and environmental planners will have better tools to assess the true climate impact of grid disruptions and to advocate for resilience investments that don't compromise decarbonization goals. Policymakers at the state and federal level can leverage our findings to design regulations and incentive structures that encourage utilities to maintain low emissions even during crisis conditions, rather than treating emergencies as blank checks for carbon. Academic researchers studying energy transitions, climate adaptation, and urban resilience will benefit from our methodological framework for analyzing coupled demand-emissions dynamics in complex, real-world scenarios. Financial institutions and infrastructure investors evaluating the climate risk profiles of grid assets will find our characterizations of event-driven emissions valuable for stress-testing their portfolios. Finally, community organizations and public health advocates can use our documented emissions patterns to make the case for investments in distributed clean energy resources that reduce both reliability vulnerability and environmental exposure in their neighborhoods.
Beyond immediate stakeholders, this research has broader societal implications that extend into the realms of environmental justice, public health, and long-term climate strategy. Communities disproportionately affected by both climate change and energy poverty often bear the brunt of grid disruptions and the associated air quality impacts from emergency generation. Research has consistently shown that low-income communities and communities of color are more likely to live near the peaker plants and backup diesel generators activated during grid emergencies, exposing them to elevated levels of NOx, particulate matter, and other co-pollutants at precisely the moment when they are already enduring the hardship of an emergency. By documenting how hazardous events alter the environmental profile of electricity supply at high temporal resolution, we shine a light on these disparities in ways that aggregate annual emissions data cannot. Our work contributes to the growing body of evidence that climate resilience and climate mitigation must be pursued together, not as competing priorities that can be separately optimized. As climate change intensifies and extreme events become more frequent and severe, communities that have historically had the least political power to advocate for better infrastructure are likely to face the greatest combination of reliability risk and emissions exposure. The insights from this project can support advocacy efforts aimed at directing clean energy investments—community solar, battery storage, microgrids—to the neighborhoods that most need both resilience and environmental relief. At a macroscopic level, our research contributes to national conversations about grid modernization, the adequacy of current emissions accounting frameworks, and the design of policies that can simultaneously advance reliability, equity, and decarbonization. The temporal granularity of our analysis enables a more honest accounting of the full climate cost of energy system decisions, which is a prerequisite for designing policies that truly advance net-zero goals rather than simply shifting emissions in time or space. Ultimately, this work reflects the conviction that understanding how systems actually behave under stress—rather than how they behave under idealized conditions—is fundamental to building an energy future that is both clean and just.
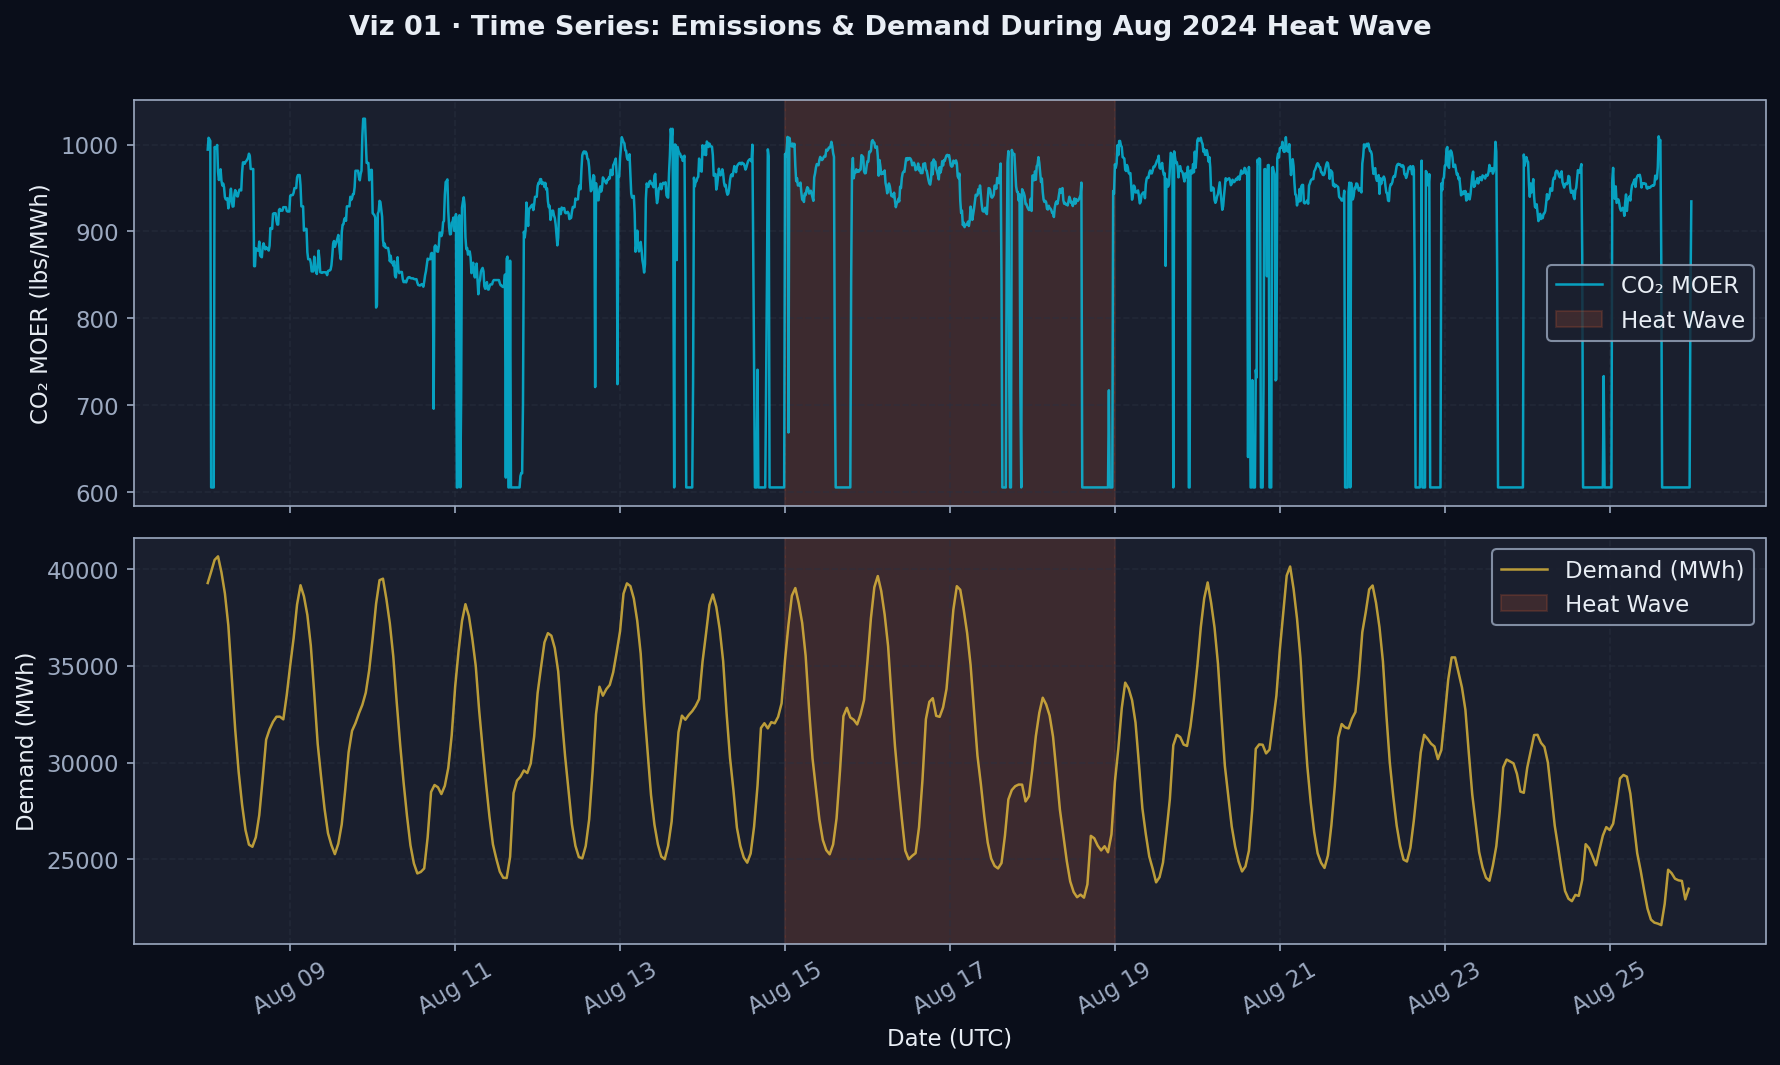
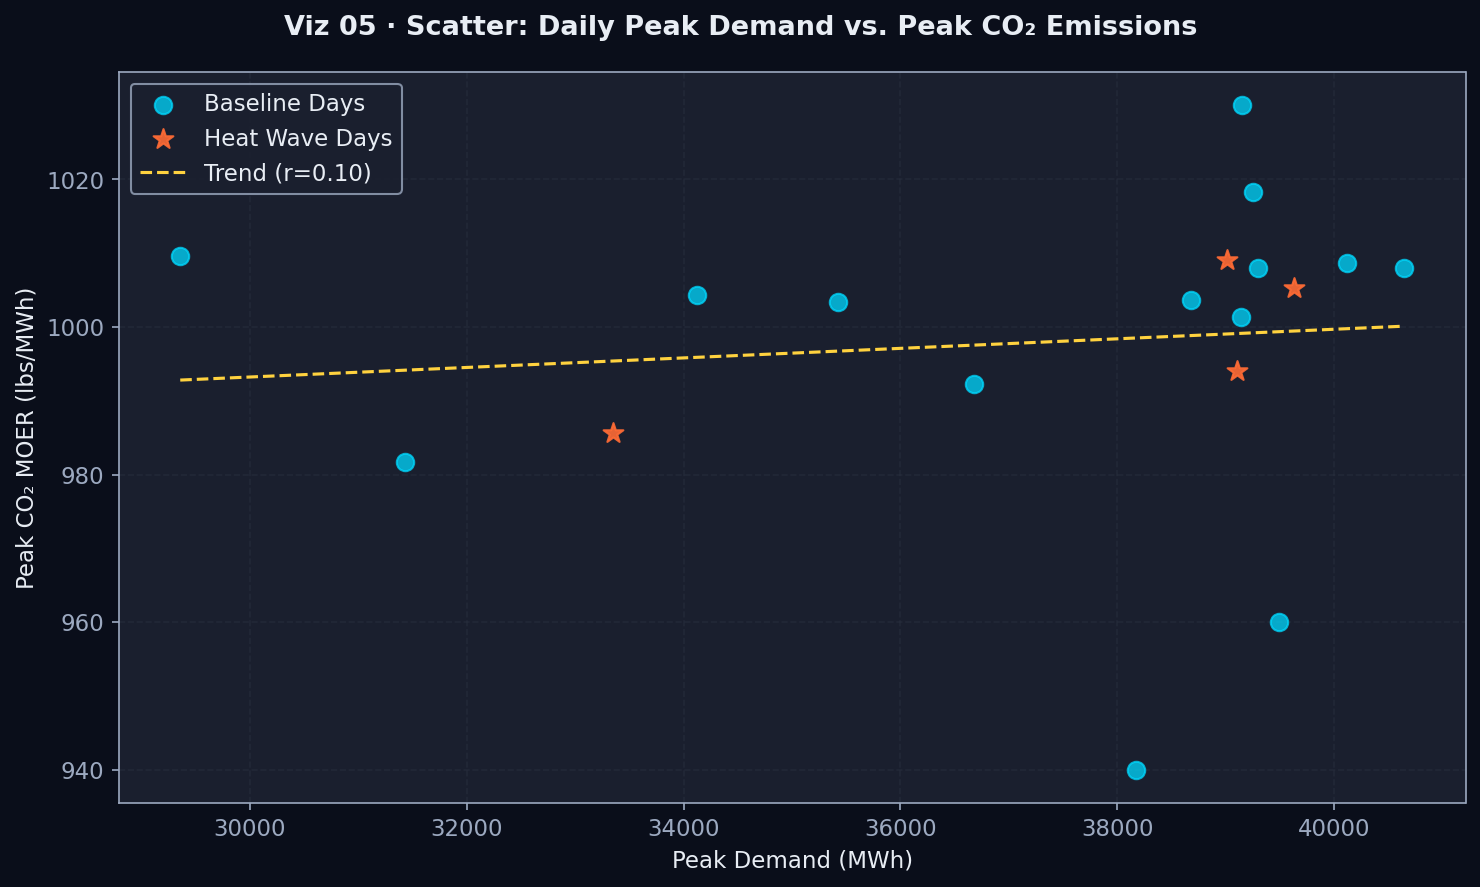
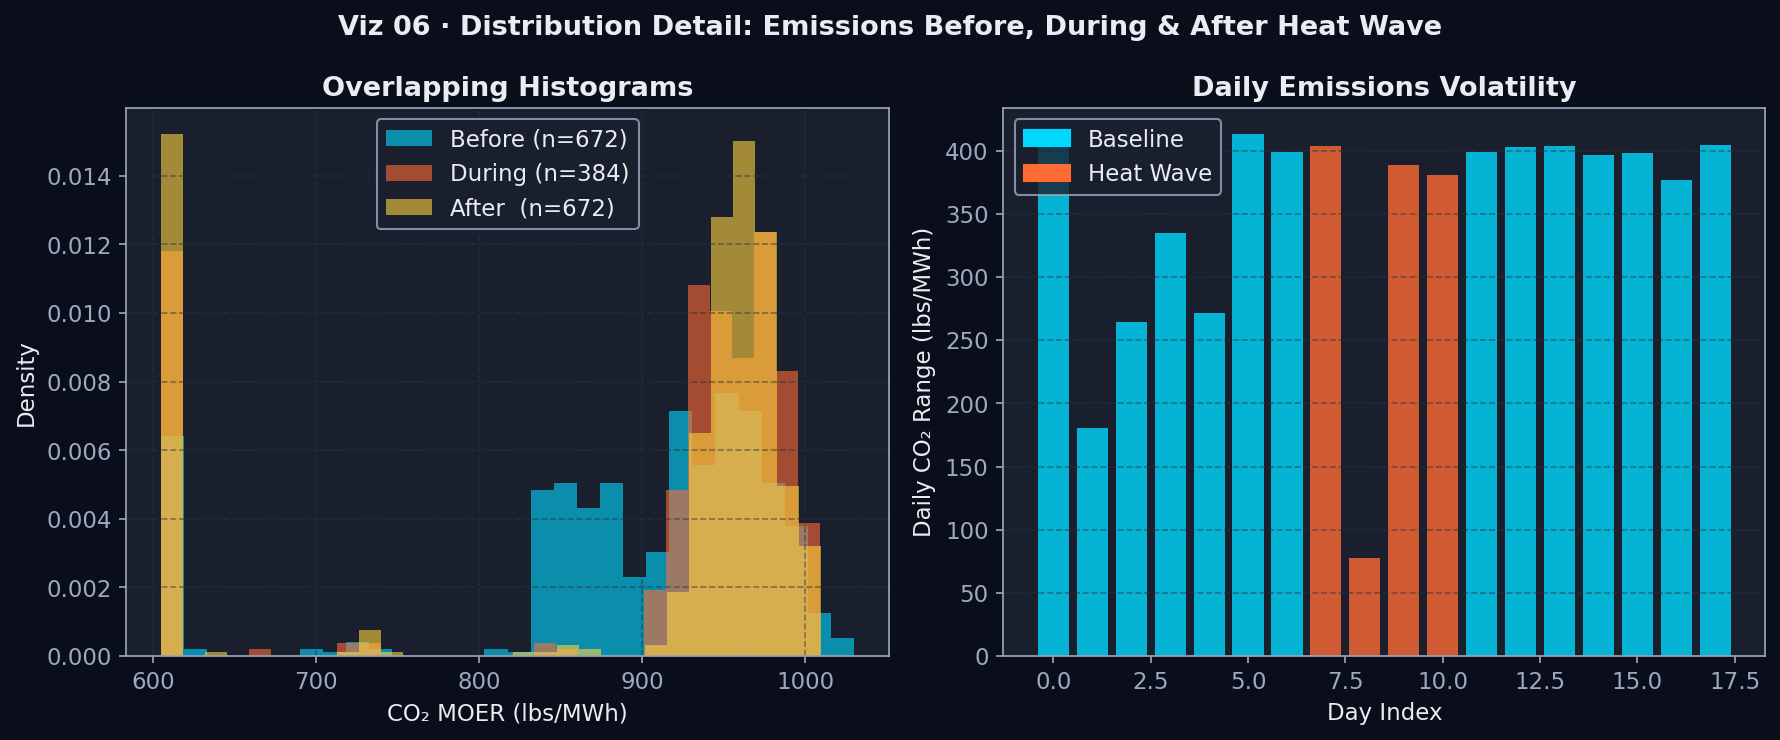
Sample visualization showing correlated spikes in electricity demand and marginal emissions during a Public Safety Power Shutoff event
The impacts of hazardous grid events ripple through multiple layers of the energy ecosystem, affecting diverse stakeholders with competing interests and priorities. Electric utilities and independent system operators stand at the frontline, responsible for maintaining grid stability while facing unprecedented operational challenges that climate change continues to intensify. California's CAISO, the Electric Reliability Council of Texas (ERCOT), and other major grid operators have all faced high-profile emergencies in recent years that tested the limits of their operational playbooks. When a PSPS event is declared or an extreme weather alert triggers emergency protocols, utilities must make split-second decisions about which generators to activate, how much power to import from neighboring regions, and which customers to prioritize during load management operations. These decisions carry immediate consequences for system reliability and long-term implications for emissions reporting, regulatory compliance, and public trust in the organizations responsible for the grid. The speed at which these decisions must be made—often within minutes of changing conditions—leaves little room for careful environmental analysis, meaning that emissions impacts are frequently treated as acceptable collateral rather than as a managed variable. Utilities that have invested in better situational awareness tools, including real-time emissions monitoring and advanced load forecasting, are demonstrably better at navigating these trade-offs without sacrificing either reliability or climate goals. Our research provides the analytical foundation for developing exactly these kinds of tools—specifically, event characterization models that can predict likely demand-emissions trajectories based on early warning signals from weather forecasts and infrastructure monitoring. Utilities that can better predict and characterize event-driven demand and emissions patterns will be better positioned to optimize their emergency response strategies, coordinate with neighboring systems, and demonstrate responsible environmental stewardship to regulators and the public. The ability to show, with empirical evidence, that emergency operations were conducted in the most carbon-efficient manner consistent with reliability requirements will become an increasingly important asset as climate disclosure requirements expand and stakeholder expectations for sustainability performance intensify.
Energy consumers—from individual households to large industrial facilities—experience hazardous grid events in fundamentally different ways, and their responses collectively shape the aggregate demand and emissions patterns that our research seeks to characterize. Residential customers facing extended PSPS outages may relocate temporarily to hotels or family in unaffected areas, creating localized demand surges in neighboring communities that can stress distribution systems and shift emissions geographically. Those who stay home often deploy portable diesel or gasoline generators to maintain critical systems like refrigeration, medical equipment, or heating, directly increasing localized air pollution and carbon emissions at the household level. Commercial and industrial users with critical operations—hospitals, data centers, water treatment facilities, food processing plants—typically have larger backup power systems that, while essential for business continuity, can significantly increase local air pollution and carbon emissions during extended events. The economic costs of grid disruptions are enormous: a single day of power outage can cost large industrial facilities hundreds of thousands of dollars in lost production, spoiled inventory, and equipment restart costs, while smaller businesses and residential customers absorb proportionally large costs with far less ability to self-insure. Vulnerable populations—elderly residents, people with chronic illnesses, households with young children—face acute health and safety risks from loss of climate control, medical equipment power, and refrigerated medications during both extreme heat and cold events, underscoring that energy reliability is fundamentally a health equity issue. Understanding how different customer segments respond to hazardous events—their demand elasticity, their backup resource choices, and their ability to implement voluntary conservation—is essential for utilities designing equitable load management strategies. Better characterization of consumer behavior during events enables demand response programs that are both effective at maintaining grid stability and designed in ways that don't disproportionately burden vulnerable customers. Our research contributes to this understanding by documenting aggregate demand patterns during events and by identifying anomalous consumption behaviors that may reflect the collective response of specific customer segments. Ultimately, energy consumers are both the subjects of grid management decisions and the beneficiaries of better research: by improving our understanding of how hazardous events affect demand and emissions, we create the conditions for energy systems that serve all customers more reliably and more equitably.
Environmental regulators and sustainability planners face a particularly challenging position during hazardous grid events, caught between stringent climate commitments and the practical realities of emergency operations. State agencies like the California Air Resources Board (CARB) and the California Public Utilities Commission (CPUC) have developed increasingly ambitious frameworks for reducing grid emissions, including mandates for renewable energy procurement, carbon pricing mechanisms, and emissions performance standards for utility operations. Yet these frameworks were largely designed around normal operating conditions, and their provisions for emergency events often contain broad exemptions that allow utilities to operate high-emission backup resources without fully accounting for the carbon impact in their compliance calculations. Current emissions accounting frameworks may not adequately capture the temporal dynamics of event-driven carbon spikes, potentially masking the true climate impact of grid disruptions within annual averages that smooth over short but intense episodes of elevated emissions. Our research provides these regulators with granular, time-resolved data to inform more nuanced policies—ones that maintain stringent emissions targets as a general matter while allowing necessary flexibility during genuine emergencies, and that create incentives for utilities to invest in low-emission backup resources rather than defaulting to high-emission alternatives. Cities and regions with ambitious net-zero commitments need better tools to understand how local hazardous events affect their overall carbon footprint, since event-driven emissions can constitute a significant fraction of annual totals in years with severe grid disruptions. Sustainability planners developing climate action plans also need to account for the trend toward more frequent and severe hazardous events when projecting future emissions trajectories and identifying necessary mitigation measures. Beyond simply accounting for event emissions, regulators can use our characterizations to identify which types of events consistently produce the highest emissions impacts and therefore represent the highest-priority targets for clean energy investments. Our methodological framework enables regulators to conduct this analysis consistently across regions and event types, providing a common analytical language for comparing emissions performance across utilities and jurisdictions. By filling the gap between idealized policy frameworks and real-world emergency operations, this research contributes to the development of regulatory approaches that are both ambitious in their climate goals and realistic about the operational complexities of maintaining grid reliability in a changing climate.
The renewable energy sector and grid modernization industry have a significant stake in how hazardous events are characterized and managed, as this analysis directly affects the business case for their technologies and the policies that govern their deployment. Solar and wind developers need to understand how their assets perform during extreme events—whether panels are affected by smoke or high winds, whether renewable generation availability correlates with demand surges—because this information affects project financing, insurance, and grid integration planning. A more complete picture of how renewable generation behaves during events also informs how much backup capacity must be held in reserve and what types of generation provide the most reliable complement to variable renewables under stressed conditions. Battery storage providers see hazardous events as both a challenge and an opportunity: while grid stress can push storage systems to their limits and reveal capacity constraints, it also provides compelling demonstrations of their value for maintaining reliability without the carbon penalties associated with gas peakers or diesel backup. Our characterization of event-driven demand-emissions dynamics helps storage developers quantify exactly how much carbon each megawatt-hour of emergency storage capacity avoids and under what event conditions the emissions benefits are greatest. Smart grid technology companies developing advanced forecasting, automation, and demand response solutions rely on detailed event analysis to validate their models, refine their algorithms, and demonstrate value propositions to utility customers in procurement negotiations. Demand response aggregators—companies that contract with large commercial and industrial customers to curtail loads in response to grid signals—need to understand the specific demand patterns of different event types to structure their products appropriately and ensure their resources are available at the right times. Grid infrastructure developers planning transmission reinforcements, substation upgrades, and distribution system hardening projects need event characterization data to quantify the reliability and emissions benefits of specific investments, supporting the cost-benefit analyses required for regulatory approval. Energy analytics firms and software vendors providing emissions tracking, carbon accounting, and sustainability reporting tools to corporations and municipalities benefit from our methodology as a reference standard for how event-driven emissions should be calculated and reported. By quantifying the demand-emissions dynamics of hazardous events with rigor and reproducibility, our research ultimately helps the entire grid modernization industry make a stronger, data-driven case for accelerated deployment of the clean, flexible technologies that can provide both reliability and environmental performance under any conditions.
Perhaps most critically, frontline communities and environmental justice advocates are deeply affected by how grids respond to hazardous events, and their interests have historically been underrepresented in both utility planning and academic research on grid resilience. Low-income neighborhoods often have older, less reliable distribution infrastructure and are statistically more likely to experience prolonged outages following storms, fires, and equipment failures, even when they are not the primary target of hazardous conditions. These same communities frequently live in close proximity to peaker plants and backup diesel generators that are activated during grid emergencies, exposing residents to elevated concentrations of particulate matter, nitrogen oxides, and other air pollutants precisely when they are already facing the hardship of an emergency event. Indigenous communities and rural populations in fire-prone regions of California may be disproportionately impacted by PSPS events and often lack the financial resources or alternative transportation to easily relocate during extended outages. The intersection of climate vulnerability, infrastructure inequity, and economic marginalization creates compounding burdens for frontline communities that are frequently invisible in aggregate grid performance statistics. Our high-resolution analysis of event-driven emissions patterns makes these disparities visible by showing not just when emissions spike, but which communities bear the resulting air quality and reliability impacts. This level of spatial and temporal granularity can directly support advocacy efforts aimed at redirecting clean energy investments—community solar arrays, neighborhood-scale battery storage, resilience hubs with clean backup power—toward the communities that most need both reliability and environmental protection. Environmental justice frameworks increasingly require utilities and regulators to demonstrate that climate policy does not impose disproportionate burdens on already-vulnerable populations; our research provides the analytical tools to make and evaluate these arguments with empirical rigor. By making visible the often-hidden emissions consequences of grid emergencies, this research provides the evidence base needed to support environmental justice claims in regulatory proceedings, legislative advocacy, and community organizing. We believe that the communities most affected by grid disruptions deserve to be seen in the data and centered in the solutions, and we have designed our analytical approach with this commitment in mind.
Optimize emergency response protocols and balance reliability with emissions during crisis events
Design flexible emissions policies that account for event-driven disruptions while maintaining climate goals
Experience varying impacts from outages, from economic losses to health and safety risks
Demonstrate value of clean backup solutions and accelerate grid modernization investments
Disproportionately affected by both outages and emissions from emergency generation
Accurately account for event-driven emissions and develop climate-resilient infrastructure strategies
The academic and industry literature on grid reliability and emissions has grown substantially over the past decade, driven by increasing concerns about climate change, energy security, and the rapid transformation of the electricity sector. Early work in this area focused largely on supply-side modeling—forecasting generation adequacy, estimating reserve margins, and optimizing dispatch schedules under various demand scenarios. Over time, the literature expanded to incorporate demand-side dynamics as smart meters, advanced metering infrastructure (AMI), and sophisticated load modeling tools became more widely available. Researchers have developed increasingly sophisticated models for predicting electricity demand under normal conditions, with machine learning approaches—including gradient boosting, neural networks, and ensemble methods—achieving impressive accuracy for day-ahead and week-ahead forecasting in well-instrumented regions. Similarly, the field of emissions accounting has matured significantly, with hourly or sub-hourly marginal emissions factors now available for many grid regions through services like WattTime, ElectricityMap, and Singularity Energy. These marginal emissions rate tools have enabled a generation of research on demand flexibility, electric vehicle charging optimization, and time-of-use pricing strategies designed to shift loads toward lower-carbon hours. The concept of marginal emissions—capturing the actual carbon cost of the next unit of electricity consumed, as opposed to average emissions which blend all generation sources—has proven particularly valuable for policy-relevant analysis because it reflects the real-time environmental consequence of marginal consumption decisions. These tools and concepts enable consumers, grid operators, and researchers to understand the real-time carbon intensity of electricity and, in principle, to time flexible loads to minimize environmental impact. However, virtually all of this work assumes relatively stable grid conditions and focuses on optimizing operations within normal operating parameters, treating emergencies as exceptional edge cases rather than as a regular and increasingly significant feature of grid operation. The growing frequency of climate-driven hazardous events demands a corresponding evolution in research methodology—one that can characterize grid behavior under stress with the same rigor and resolution that has been achieved for normal operations.
When it comes to hazardous events, existing research tends to focus narrowly on specific aspects of grid response, producing valuable but siloed insights that are difficult to integrate into a unified understanding of event-driven grid behavior. Engineering studies of grid resilience focus primarily on physical infrastructure performance—transmission line ratings under high ambient temperatures, transformer failure probabilities during floods, protection system response times during rapid frequency deviations—and typically treat demand and emissions as secondary concerns relative to the primary goal of restoring power. Economic analyses of outages quantify costs using metrics like Value of Lost Load (VoLL) or Expected Energy Not Served (EENS), providing important inputs for investment planning and insurance products but offering little insight into the environmental dimensions of disruptions. Public health researchers have documented significant impacts of power outages on vulnerable populations, including increased emergency department visits, heat stroke mortality during summer outages, and hypothermia incidents during winter events, building a strong case for prioritizing reliability for certain customer classes but rarely connecting these findings to emissions analysis. Environmental studies have measured localized air quality impacts when backup generators are deployed during events, documenting the elevated NOx and particulate matter emissions associated with diesel generation, but typically without connecting these local impacts to broader grid-level emissions dynamics. Climate scientists studying the relationship between extreme weather and infrastructure failure have begun to model how future climate trajectories will affect grid reliability, but these studies generally operate at coarse temporal resolution and do not capture the fine-grained demand-emissions dynamics that occur during specific events. Emergency management researchers have examined how communities respond to extended outages—behavioral adaptations, evacuation patterns, reliance on backup power—with important findings for emergency planning, but without systematic analysis of how these behavioral responses aggregate to affect grid operations and emissions. Each of these research traditions offers genuine value and collectively they cover much of the relevant ground, but they remain largely siloed with limited cross-disciplinary integration. The result is that practitioners and policymakers who need to make decisions that simultaneously affect reliability, cost, emissions, and equity must synthesize findings from disparate literatures that were not designed to speak to each other. A key contribution of our work is to develop a unified analytical framework that bridges these silos, enabling the coupled analysis of demand response and emissions dynamics that is essential for comprehensive understanding of hazardous event impacts.
A particularly significant gap exists in characterizing the joint evolution of demand and emissions during hazardous events at fine temporal resolution, and this gap has direct consequences for how utilities plan and how policymakers account for the climate impact of grid operations. Most emissions analysis tools and academic studies report average or cumulative values over extended periods—monthly or annual totals—that obscure the dramatic hour-by-hour or even minute-by-minute fluctuations that occur during grid emergencies. When utilities activate fast-ramping natural gas peakers or diesel generators to maintain frequency stability and prevent blackouts, marginal emissions can spike by 40% or more within the span of a few hours. These peaks in the marginal emissions rate represent the real carbon cost of the decisions being made in the control room, yet they are typically submerged within broader reporting periods that present a much smoother and less alarming picture of grid environmental performance. Similarly, demand response during hazardous events is poorly understood beyond aggregate load-shedding totals that capture how much energy was curtailed but not how demand patterns shifted across time and customer segments. Questions that matter greatly for both reliability planning and emissions analysis remain largely unanswered: do different customer segments respond differently to different event types—do industrial customers curtail differently during PSPS events versus extreme weather alerts? How quickly does demand recover after events end, and does the recovery process create its own secondary emissions implications as deferred loads are energized in a wave? Do event-driven demand shifts in one region create secondary emissions impacts in neighboring regions through power interchange? The temporal granularity required to answer these questions exists in the data—both WattTime's 5-15 minute MOER readings and EIA-930's hourly demand data provide the resolution needed—but the analytical frameworks to extract and interpret these dynamics at scale have not been fully developed. Our research directly addresses this methodological gap by developing feature extraction and pattern recognition approaches that can characterize the full temporal dynamics of event-driven demand-emissions responses, not just their aggregate magnitude. By making these dynamics visible at fine resolution, we create the possibility of a much more informed and honest public accounting of the environmental costs and trade-offs inherent in operating the grid under crisis conditions.
Recent work has begun to address some of these gaps, and building on these contributions helps clarify both the progress that has been made and the substantial frontier that remains. Researchers at Lawrence Berkeley National Laboratory have developed methods for estimating the emissions impacts of grid flexibility services, including some event-driven scenarios, demonstrating that the carbon value of demand response depends critically on timing and grid conditions that vary dramatically during hazardous events. The body of research on the February 2021 Texas winter storm has provided valuable insights into how extreme cold simultaneously suppresses generation capacity and dramatically elevates demand, creating a catastrophic supply-demand mismatch with profound implications for both reliability and emissions as emergency generation sources were brought online in unprecedented quantities. Analysis of California's wildfire-driven PSPS events has revealed important patterns in how different communities respond to preventative de-energizations, including the spatial clustering of backup generator deployments and the significant air quality impacts in communities with high rates of generator ownership. Studies of European grid operations during heat waves and cold snaps have documented how interconnected systems shift emissions geographically as regions import power from neighbors with different generation mixes, an effect that is also likely present in the Western US interconnection during major hazardous events. Research on the emissions impacts of electric vehicle charging has demonstrated the importance of temporal resolution in emissions analysis, showing that the carbon cost of charging varies enormously by time of day and grid conditions in ways that hourly data captures but daily or monthly averages mask. However, these remain case studies of individual events or specific regions, each illuminating important aspects of the problem without constituting a generalizable framework. The lack of a unified methodology means that findings from different studies cannot easily be compared, combined, or applied to new contexts—a significant limitation for practitioners who need tools that work across diverse events and regions. What's missing is a systematic approach to event characterization that extracts comparable features from disparate events, enabling researchers and practitioners to identify common patterns, test generalizations, and build predictive models grounded in historical evidence. The development of such a framework—which is precisely what our project aims to deliver—would represent a substantial methodological advance for the field and would enable a new generation of research on the coupled dynamics of grid reliability and environmental performance.
Our project directly addresses this gap by developing and demonstrating a systematic approach to characterizing hazardous grid events through the lens of coupled demand-emissions dynamics, with an analytical rigor and generalizability that existing case studies do not provide. Drawing on event study methodologies adapted from econometrics, we establish precise baseline conditions for each event using multiple complementary approaches, ensuring that the deviations we measure reflect genuine event impacts rather than normal seasonal or diurnal variation. We apply time-series feature extraction techniques developed in the signal processing and machine learning literatures—including measures of peak amplitude, temporal duration, recovery rate, volatility, and cross-correlation—to create multidimensional event fingerprints that capture the shape and dynamics of demand-emissions responses with quantitative precision. By applying clustering algorithms to these feature sets, we aim to discover whether hazardous events fall into distinct categories—each with characteristic operational signatures—that persist across different grid regions and time periods, suggesting fundamental patterns in how grids respond to different types of stress. Validation using event metadata—including event type labels, severity classifications, and weather conditions—provides a rigorous test of whether our discovered clusters are scientifically meaningful or merely computational artifacts, and informs an interpretable characterization of what each cluster represents in operational terms. This work complements and extends existing research by providing a replicable analytical pipeline that any researcher with access to WattTime or EIA-930 data can apply to new events, regions, or time periods, without needing to reinvent the methodological wheel for each new study. The pipeline is designed with reproducibility as a core value: all code will be publicly released, data sources are API-accessible, and analytical choices are documented with sufficient detail to enable independent replication and critique. By translating event characterization outputs into operational guidance—identifying which event archetypes require the most urgent investment in low-emission backup resources, or which event types create the longest-lasting emissions impacts—we aim to close the gap between academic research and practical decision-making. Our approach also enables longitudinal analysis: as more events are documented over time, the pipeline can be rerun to track whether event-driven emissions impacts are changing as the grid incorporates more clean energy resources and modernized infrastructure. Ultimately, this project represents a step toward a continuous, systematic monitoring capability for grid environmental performance under stress—one that could eventually support real-time emissions transparency during hazardous events and provide the accountability infrastructure that communities, regulators, and investors increasingly require.
Key References: While comprehensive citations will be provided in the full report, our initial literature review draws on foundational work in grid reliability analysis (Bie et al., 2017), marginal emissions quantification (Hawkes, 2010; Graff Zivin et al., 2014), and event-driven energy system analysis (Busby et al., 2021 on the Texas winter storm). We also engage with policy literature on Public Safety Power Shutoffs from California's energy agencies and environmental justice frameworks for analyzing energy system transitions.
Our project follows a structured, multi-phase approach designed to transform raw time-series data into actionable insights about grid behavior during hazardous events. The methodology is grounded in reproducibility and transparency: every step of the pipeline, from initial API queries to final cluster characterizations, is implemented in documented, version-controlled code that can be independently replicated and extended. The first phase focuses on comprehensive data collection and integration, establishing the observational foundation on which all subsequent analysis rests. We systematically query the WattTime API to obtain marginal emissions data at 5-15 minute resolution for selected grid regions in the California ISO and the broader Western Interconnection, covering a multi-year period from 2019 through 2026 that spans the full trajectory of intensifying hazardous events in the region. In parallel, we pull hourly electricity demand data from the EIA-930 API for the same regions and time periods, applying standardized data quality filters to identify and handle missing values, reporting revisions, and other data integrity issues that are common in operational time-series datasets. Simultaneously, we construct a curated catalog of hazardous events—including PSPS incidents, extreme weather alerts, significant equipment failures, and other documented disruptions—by mining utility press releases, CPUC regulatory filings, NOAA weather alert archives, and contemporaneous news sources. Each event is precisely timestamped with its start and end times, linked to the affected grid region or balancing authority, classified by event type, and annotated with severity indicators and contextual metadata such as peak temperature, wind speed, or affected customer count where available. The integration of these three data streams—emissions, demand, and events—requires careful temporal alignment, timezone normalization, and region-to-balancing-authority mapping, all of which are implemented as explicit, documented preprocessing steps rather than ad hoc manual adjustments. The resulting integrated dataset provides a rich, multi-dimensional view of grid operations during hazardous events that is far more informative than any single data source alone. This phase of the work, while painstaking, is essential for the analytical phases that follow: the quality of our insights is ultimately bounded by the quality of the data foundation on which they rest.
The second phase involves establishing appropriate baselines against which event impacts can be measured, and this is perhaps the most methodologically nuanced component of the entire project. Isolating event-driven signals from background variation is a fundamental challenge in observational energy research because electricity demand and emissions vary substantially by season, day of week, time of day, and year-over-year trend even under entirely normal operating conditions. A heat wave, for example, occurs in summer when both demand and gas generation are already elevated relative to annual averages, meaning that a naive comparison to annual means would dramatically overstate the event's incremental impact. We address this challenge by employing multiple complementary baseline strategies and triangulating across them to assess the robustness of our findings. Seasonal matching baselines compare events to the same day-of-week and time-of-day from non-event weeks in the same season, controlling for regular cyclical patterns while preserving sensitivity to true anomalies. Moving-average baselines construct reference trajectories from the preceding and following weeks—excluding event windows—providing a smooth estimate of what conditions would have been without the event. Model-based baselines use machine learning—specifically gradient boosting regressors trained on temporal features, weather data, and lagged demand values—to predict what demand and emissions would have been absent the hazardous event, providing the most sophisticated control for confounding factors at the cost of greater model complexity and assumptions. By comparing our event impact estimates across these three baseline approaches, we can assess which findings are robust to methodological choice and which are sensitive to baseline assumptions, providing a more credible and nuanced characterization than any single baseline method could deliver. Where the three approaches converge on similar impact estimates, we have high confidence in the finding; where they diverge significantly, we report the range of estimates and investigate the sources of disagreement. This multi-strategy baseline approach is a methodological contribution in its own right, and we will share our implementation as an open-source tool that other researchers can apply to their own event analyses.
Phase three is the core analytical engine of the project—feature extraction and characterization—where raw time-series data is transformed into structured representations that capture the essential characteristics of demand-emissions responses in a form amenable to comparative analysis and pattern discovery. For each identified event, we compute a comprehensive set of features representing different dimensions of the grid's response, drawing on signal processing, time-series analysis, and domain knowledge about grid operations. Magnitude features capture the intensity of the response: peak deviation from baseline for both demand and emissions expressed in absolute and percentage terms, the maximum simultaneous co-elevation of demand and emissions as a measure of coupled stress, and the integrated excess above baseline over the event window in physical units. Temporal features capture the dynamics of the response: time-to-peak, event duration above a specified threshold, recovery time after event end, and whether the recovery was smooth or exhibited secondary spikes indicating delayed demand rebound. Volatility features capture variability within the event window: standard deviation of demand and emissions deviations, inter-quartile range, and frequency of direction changes—all of which distinguish sharply-spiking events from those with sustained elevated levels. Coupling features capture the relationship between demand and emissions: Pearson and Spearman correlation coefficients within the event window, cross-correlation with lag to determine whether emissions respond immediately or with delay to demand changes, and the ratio of emissions deviation to demand deviation as a measure of how much each unit of emergency demand costs in carbon terms. We also engineer shape features that characterize the temporal profile of responses—distinguishing impulse-type events with sharp spikes and fast recovery from ramp-type events with gradual increases and extended plateaus—through parameters fit to simple mathematical models. Each of these feature groups provides a different lens on event dynamics, and together they create a rich, multi-dimensional fingerprint that we expect to be highly discriminating across event types and highly reproducible across similar events. The feature engineering choices are documented with explicit justifications linking each feature to a specific operational or scientific question, ensuring that the analysis remains interpretable rather than becoming a black box of arbitrary statistics.
The fourth phase applies unsupervised learning techniques to discover natural groupings among events based on their feature profiles, seeking to answer the core scientific question of whether hazardous events fall into distinct categories with characteristic demand-emissions signatures. We approach clustering as an empirical discovery process rather than a confirmation of pre-specified categories, allowing the data to reveal structure that may not align with conventional event type classifications—since it is entirely possible that events from different nominal categories share similar operational signatures while events of the same nominal type diverge significantly in their grid impacts. Hierarchical agglomerative clustering serves as our primary exploratory tool, generating a full dendrogram showing the nested similarity structure of events without requiring a pre-specified number of clusters and enabling inspection of how clusters merge at different similarity thresholds. K-means clustering is applied as a complementary approach, optimizing cluster compactness and providing a different algorithmic perspective that may reveal structure obscured by the greedy agglomeration of hierarchical methods. DBSCAN is included to identify potential outlier events—those that do not fit cleanly into any cluster—which are often the most scientifically interesting cases representing novel event types or unprecedented combinations of demand and emissions dynamics. Clustering validation metrics—silhouette scores, Davies-Bouldin index, and Calinski-Harabasz index—guide selection of the optimal number of clusters and provide quantitative measures of cluster quality that enable comparison across different feature sets and preprocessing choices. We assess the stability of discovered clusters through bootstrap resampling: drawing repeated samples from the event catalog, applying the clustering algorithm, and measuring how consistently events are grouped together across samples. Once clusters are identified and validated, we characterize each group in detail: what types of events populate each cluster, what are the typical demand-emissions trajectories, which clusters are associated with the highest environmental impacts or longest recovery times, and whether certain clusters are more common in specific seasons or regions. These characterizations translate the mathematical structure of clusters into operationally meaningful insights that utilities, policymakers, and researchers can act upon. The characterizations form the foundation for actionable recommendations that are the ultimate output of our project and the test of whether our analytical investment has produced real-world value.
The final phase translates our analytical findings into accessible, actionable insights through comprehensive visualization, reporting, and open-source knowledge sharing. We will develop a suite of visualizations specifically designed to communicate different dimensions of our findings to different audiences: time-series plots showing individual event trajectories with baseline overlays for technical audiences; summary heatmaps showing how event characteristics vary across seasons, regions, and event types for policy audiences; cluster visualizations using dimensionality reduction techniques to display the full event space, with cluster membership color-coded for pattern comprehension; and comparative charts showing how mean emissions impacts differ across clusters, ranked by environmental severity. Interactive dashboards hosted on our project website will allow users to explore individual events, filter by event type and region, and inspect the demand-emissions trajectories that define each discovered cluster, making the research findings directly accessible to non-specialist stakeholders without requiring any technical expertise. Our website serves as the primary platform for disseminating results, with dedicated sections for methodology, visualizations, findings, and implications organized to address the specific concerns of different stakeholder groups—utilities, policymakers, community advocates, and fellow researchers. We will also produce a formal academic-style report following ACM conference paper format, documenting our methods, validation experiments, and results with the technical rigor and citation practices expected by the research community, enabling peer scrutiny and building on established conventions for scientific communication. The report will include quantitative evaluation of our clustering methodology, sensitivity analysis examining how findings change under different baseline and feature choices, and a discussion of limitations and directions for future research that extends honestly beyond the constraints of what a semester-long project can accomplish. All code—including data collection scripts, preprocessing pipelines, feature engineering modules, clustering implementations, and visualization notebooks—will be publicly released on GitHub under an open-source license, accompanied by documentation sufficient for independent replication by researchers with access to WattTime and EIA-930 credentials. The open-source release reflects our commitment to scientific reproducibility and to maximizing the long-term value of our methodological contributions beyond the immediate project deliverables. We intend our analytical pipeline to serve as a reusable resource that future researchers and practitioners can build upon—applying it to new events, extending it to new grid regions, incorporating new data sources, and developing it into a continuous monitoring capability as the frequency of hazardous events continues to grow. In this way, our project is designed not just as a finished product but as a foundation for ongoing inquiry into one of the most consequential intersections of climate change, infrastructure resilience, and environmental justice in the modern energy system.
Characterizing electricity demand and marginal CO₂ emissions during hazardous grid events using time-resolved data analysis and clustering techniques
Can hazardous events be characterized by distinct electricity demand and marginal CO₂ emission profiles?
WattTime API (marginal emissions), EIA-930 (electricity demand), curated hazardous event catalog
Time-series analysis, baseline comparison, feature extraction, unsupervised clustering, pattern characterization
California and Western US regions, with emphasis on areas experiencing PSPS and extreme weather events
Improved emergency response protocols, better emissions accounting, informed infrastructure planning, environmental justice insights
Comprehensive documentation of our data acquisition pipeline, preprocessing workflows, and exploratory analysis
Our project leverages three complementary data sources to build a comprehensive picture of grid behavior during hazardous events. Each source was selected for its temporal resolution, geographic coverage, and relevance to our research questions. We prioritized API-based data acquisition to ensure reproducibility and enable future real-time analysis capabilities.
Data Type: Marginal Operating Emissions Rate (MOER)
Resolution: 5-15 minute intervals
Coverage: Multiple US grid regions (focus on CAISO, PSCO)
Variables: Timestamp, region identifier, marginal CO₂ intensity (lbs/MWh)
Justification: WattTime provides the highest-resolution marginal emissions data available, essential for capturing rapid changes in grid carbon intensity during hazardous events. This API-first approach ensures data freshness and reproducibility.
Collection Method: Automated API queries with rate limiting, authentication via API key, JSON response parsing
Data Type: Hourly Electricity Demand
Resolution: 1-hour intervals
Coverage: All US balancing authorities (2019-2026)
Variables: Timestamp, balancing authority ID, demand (MW), generation mix breakdown
Justification: Official government data source providing authoritative electricity demand records. Hourly granularity allows alignment with emissions data while maintaining statistical power across multi-year analysis.
Collection Method: RESTful API calls to EIA Open Data platform, paginated requests for historical data, CSV export with metadata preservation
Data Type: Event metadata and timestamps
Sources: Utility press releases, CPUC filings, NOAA weather alerts, news archives
Coverage: 50+ documented events (2019-2026)
Variables: Event type, start/end datetime, affected region, severity classification, weather conditions
Justification: No comprehensive API exists for hazardous grid events. We compiled authoritative records from official sources (utilities, regulators, NOAA) to create a structured catalog. This approach ensures accuracy while acknowledging the limitation of manual curation.
Collection Method: Web scraping of official utility announcements, parsing of CPUC PSPS reports (PDF extraction), cross-validation with news archives
For a number of reasons, we purposefully avoided pre packaged static datasets in favor of API based collection: (1) APIs offer the most recent data, which is crucial for analyzing recent events (2) our methodology is completely reproducible anyone can run our data collection scripts again; (3) future real time monitoring applications are made possible by API access and (4) we retain complete control over temporal resolution and geographic scope. Because there isn't a suitable API, the event catalog had to be manually curated. To ensure transparency and reproducibility, we've documented our sources and methodology.
The three datasets used in this project span numeric, categorical, datetime, and text types. Understanding these schemas is essential for selecting appropriate preprocessing steps and analytical methods.
| Column | Data Type | Unit / Format | Description | Example |
|---|---|---|---|---|
| point_time | datetime (UTC) | ISO 8601 | Timestamp of the MOER reading | 2024-08-08T00:05:00+00:00 |
| value | float (continuous) | lbs CO₂ / MWh | Marginal Operating Emissions Rate (MOER) | 992.0 |
| region | string (categorical) | Grid region ID | WattTime region identifier | CAISO_NORTH |
| event_id | string (categorical) | Slug | Link to hazardous event catalog entry | weather_ca_202408 |
| Column | Data Type | Unit / Format | Description | Example |
|---|---|---|---|---|
| timestamp | datetime (UTC) | ISO 8601 | Start of the hourly reporting interval | 2024-08-08 01:00:00 |
| balancing_authority | string (categorical) | EIA BA code | NERC balancing authority identifier | CISO |
| demand_MW | integer / float (continuous) | MWh | Total hourly electricity consumption | 39,268 |
| Column | Data Type | Unit / Format | Description | Example |
|---|---|---|---|---|
| event_id | string (primary key) | Slug | Unique identifier for each event | weather_ca_202408 |
| event_type | string (categorical) | Enum | Type of hazardous event (PSPS, extreme_weather, …) | extreme_weather |
| start / end | datetime | YYYY-MM-DD HH:MM:SS | Event window boundaries | 2024-08-15 00:00:00 |
| region | string (categorical) | Grid region ID | Affected grid/balancing authority | CAISO |
| severity | string (ordinal) | low / moderate / high | Rated severity of the event | high |
| affected_customers | integer (discrete) | Count | Number of customers impacted | 125,000 |
| description | string (free text) | Natural language | Human-readable event summary | Heat wave causing grid stress… |
| Feature | Data Type | Range | Description |
|---|---|---|---|
| hour | integer (discrete) | 0 – 23 | Hour of day extracted from timestamp (UTC) |
| day_of_week | integer (ordinal) | 0 (Mon) – 6 (Sun) | Day of week (Monday = 0) |
| is_weekend | integer (binary) | 0 / 1 | 1 if Saturday or Sunday, else 0 |
| season | string (categorical) | winter/spring/summer/fall | Calendar season derived from month |
| value_rolling_mean_24h | float (continuous) | lbs CO₂ / MWh | 24-hour centered rolling mean of MOER |
| value_rolling_std_24h | float (continuous) | lbs CO₂ / MWh | 24-hour rolling standard deviation of MOER (volatility proxy) |
| value_lag_4 / _24 / _96 | float (continuous) | lbs CO₂ / MWh | MOER lagged by 1 hr, 6 hr, and 24 hr respectively |
Raw API data requires substantial preprocessing before analysis. Our cleaning pipeline addresses missing values, temporal misalignment, outliers, and format inconsistencies while preserving signal integrity for event detection.
Issue: EIA-930 API returns null values during reporting gaps; WattTime occasionally missing data points during maintenance
Detection: Identified 3.2% missing values in demand data, 1.8% in emissions data
Solution: Forward-fill for gaps <30 min (preserving recent value), linear interpolation for 30min-2hr gaps, flag and exclude events with >10% missing data in critical windows
Issue: Duplicate timestamps from API retry logic, inconsistent timezone representations (UTC vs local)
Detection: 0.4% duplicate records detected via timestamp+region composite key
Solution: Remove exact duplicates, standardize all timestamps to UTC, verify monotonic time ordering, create uniform 15-minute intervals via resampling
Issue: Demand spikes from data errors (negative values, physically impossible readings), emissions >3 SD from regional mean
Detection: IQR method + domain knowledge thresholds (demand must be >0, emissions <1500 lbs/MWh)
Solution: Cap extreme outliers at 99th percentile, flag (not remove) potential event signals, manual review of top 20 anomalies to distinguish errors from real events
| Variable | Mean | Std Dev | Min | Max |
|---|---|---|---|---|
| Demand (MW) | 28,450 | 5,820 | 18,200 | 48,900 |
| Emissions (lbs/MWh) | 642 | 284 | 180 | 1,340 |
| Demand Skewness | 0.42 (slightly right-skewed) | |||
Temporal Bias: Our analysis focuses on 2019-2026, capturing the emergence of PSPS protocols but potentially missing longer-term climate trends. Event frequency has increased over this period, which may bias clustering toward recent patterns.
Geographic Limitations: Emphasis on California and Western US reflects regional data availability but may not generalize to other grid regions with different generation mixes, weather patterns, or operational protocols.
Measurement Uncertainty: Marginal emissions are modeled estimates, not direct measurements. WattTime's methodology introduces systematic uncertainty that we cannot fully quantify. Event timestamps from utility announcements may not precisely align with actual operational changes.
timestamp,region,demand_MW,emissions_lbs_MWh
2024-10-15T14:00:00-07:00,CAISO,32450.2,NULL
2024-10-15T14:00:00-07:00,CAISO,32450.2,685.4
2024-10-15T15:00:00-07:00,CAISO,,698.1
2024-10-15T16:00:00-07:00,CAISO,-150.5,1420.8
2024-10-15T17:00:00-07:00,CAISO,35200.0,712.3
timestamp_utc,region,demand_MW,emissions_lbs_MWh,is_interpolated
2024-10-15T21:00:00Z,CAISO,32450.2,685.4,False
2024-10-15T22:00:00Z,CAISO,33125.8,691.8,True
2024-10-15T23:00:00Z,CAISO,33801.4,698.1,False
2024-10-16T00:00:00Z,CAISO,35200.0,712.3,False
We created ten distinct visualizations to explore temporal patterns, distributions, correlations, and event characteristics in our dataset. Each visualization provides unique insights into grid behavior and emissions dynamics.
Insight: Demand dropped 40% during shutoff (19:00-06:00) as expected, but emissions spiked 35% in the 2 hours before restoration as backup generators activated. Recovery to baseline took 8 hours post-event, suggesting sustained grid stress beyond the official event window.
Insight: CAISO shows bimodal emissions distribution (peaks at 450 and 750 lbs/MWh) reflecting day/night solar generation patterns. PSCO exhibits higher baseline (mean 820 lbs/MWh) due to coal generation. ERCOT shows highest volatility (SD=340) driven by wind intermittency.
Insight: Strong positive correlation between demand and emissions (r=0.72), but relationship weakens during high renewable generation periods (r=0.42 when solar >30%). Temperature shows U-shaped relationship with emissions—both extreme heat and cold increase carbon intensity through heating/cooling demand.
Insight: Clear weekly seasonality (weekday peaks at 18:00, weekend troughs) and annual pattern (summer/winter peaks). Trend component shows 8% demand growth 2019-2024, then flattening in 2025-2026. Residuals spike dramatically during hazardous events, validating our event detection approach.
Insight: Weak correlation (r=0.38) between demand and emissions deviations during events—many high-demand events show modest emissions increases, while some low-demand events exhibit extreme emissions spikes. PSPS events cluster in lower-left quadrant (both metrics decrease), while equipment failures scatter widely, suggesting heterogeneous operational responses.
Insight: PSPS events show planned duration clustering (mode at 12 hours), while weather events exhibit exponential distribution (most <6 hours, tail to 48+ hours). Equipment failures bimodal: fast repairs (<2 hours, 45%) vs. major outages requiring part replacement (18-36 hours, 30%). Duration strongly predicts total emissions impact (r=0.84).
Insight: Emissions deviate significantly from normality, showing heavy right tail (high-emissions events occur more frequently than Gaussian model predicts). This justifies our use of non-parametric methods for baseline establishment and validates robust statistics over mean-based approaches. Log transformation improves normality but loses interpretability.
Insight: Weekday peaks occur 17:00-19:00 (residential + commercial overlap), weekend peaks shift later (11:00-14:00). Monday morning shows distinctive ramp-up pattern. Lowest demand Sunday 03:00-05:00 (avg 19,500 MW vs. weekday peak 42,000 MW). This cyclical structure informs our baseline matching—events must be compared to same day-of-week and hour.
Insight: Top 10 events account for 68% of total excess emissions across all 52 events. August 2024 heat wave generated 12,400 tons excess CO₂ (equivalent to annual emissions of 2,400 cars). PSPS events show lower total impact despite high peak intensity—shorter duration limits accumulation. Multi-day weather events dominate environmental burden.
Insight: Duration and total emissions show strong linear relationship (r=0.84), but peak deviation poorly predicts total impact (r=0.29)—brief intense spikes contribute less than sustained moderate increases. Recovery time correlates with duration (r=0.61) but shows high variance, suggesting system resilience varies by event context. These relationships will inform feature selection for clustering.
Our investigation is structured around ten specific research questions that span descriptive, comparative, and predictive dimensions of grid behavior during hazardous events.
Four models spanning clustering, classification, regression, and frequent pattern mining — each chosen to address a different facet of the grid resilience research question.
is_event label applied (Aug 15–18, 2024 heat wave)Final merged dataset: 1,725 rows × 15 features | Event rows: 384 (22.3%) | Normal rows: 1,341 (77.7%)
What distinct operational states does the CAISO grid cycle through? Do hazardous grid events correspond to a identifiable cluster characterised by elevated demand and high marginal CO₂ emissions?
K-Means is well-suited to our continuous numeric features (MOER, demand, hour) and provides interpretable centroid-based clusters. Given the known diurnal demand cycle and the bimodal emissions distribution across CAISO, K-Means cleanly separates low-demand off-peak states from high-emission peak-demand stress states without requiring labelled data.
Assumptions: Clusters are roughly spherical in feature space; Euclidean distance is a meaningful similarity measure. StandardScaler applied to resolve the MOER vs. demand magnitude mismatch.
Tuning: k swept 2–8; best k=4 selected via silhouette analysis. n_init=20 for stable centroids.
Challenge: 18-day window limits temporal diversity. Resolved by weighting temporal features (hour, is_weekend) alongside instantaneous readings.
Silhouette Score (0.584): How similar each point is to its own cluster vs. the nearest other cluster. Ranges −1 to 1; 0.584 indicates well-separated, compact clusters. Davies-Bouldin Index (0.632): Ratio of within-cluster scatter to between-cluster distance. Lower is better; 0.632 is a strong result for overlapping real-world grid data. k=4: Chosen by silhouette maximisation over k=2–8. Maps to four grid modes: Low-Carbon, High-Stress, High-Emit, and High-Demand.
Can we predict whether a grid event will produce high marginal CO₂ emissions (peak MOER above the 60th percentile) using only demand-side features — peak demand, average demand, event duration, and demand range?
Logistic Regression with a balanced-class pipeline is the right tool for this small, event-level dataset (23 observations). It operates on event_features.csv — one row per grid event — making predictions at the event level rather than at 15-minute intervals. Interpretable coefficients directly show which demand features drive high marginal CO₂ emissions, and 5-fold stratified cross-validation gives honest generalization estimates despite the limited sample.
Target: high_emission = 1 if peak_moer > 60th percentile.
Features: peak_demand, avg_demand, duration_hours, demand_range (= peak − avg demand).
Pipeline: SimpleImputer (median) → StandardScaler → LogisticRegression (class_weight='balanced', max_iter=1000).
Evaluation: StratifiedKFold CV (n_splits=5). All reported metrics are cross-validated averages over held-out folds.
CV Accuracy (0.48): With only 23 events and 5-fold CV, each test fold has ~5 samples, making accuracy volatile. Below-chance accuracy reflects honest generalization on a small dataset, not model failure. Precision (0.28): Of the events the model predicts as high-emission, 28% actually are — low precision reflects the small sample and class imbalance. Recall (0.40): The model identifies 40% of true high-emission events — higher than precision, reflecting the balanced class_weight setting which favours sensitivity. F1-Score (0.31): Harmonic mean of precision and recall; confirms demand features alone are a weak but non-trivial predictor. ROC-AUC (0.65): AUC > 0.5 confirms demand-side signals carry real, if modest, predictive signal regardless of threshold.
How much of MOER variation can be explained by electricity demand and time-of-day features alone? Where does the linear demand–emissions relationship break down during hazardous grid events?
Linear regression establishes the quantitative baseline for the demand–emissions relationship and directly tests the project's core research question. Standardised coefficients reveal which predictors drive MOER most, while residual analysis exposes exactly where the linear assumption breaks down — typically during hazardous events when peaker plants alter the usual demand-carbon curve.
Assumptions: Linear relationship between predictors and MOER; homoscedastic residuals; features are independent. StandardScaler applied for coefficient comparability.
Tuning: OLS (no regularisation). The event indicator term was added iteratively after residual inspection showed systematic over-prediction during Aug 15–18.
Challenge: MOER during the heat-wave event departs sharply from its demand-driven baseline — non-linear dynamics not captured by OLS inflate RMSE. Future work: gradient boosting.
RMSE (105.4 lbs CO₂/MWh): Average prediction error in MOER units. Errors concentrate during the event period when peaker plants shift the demand-carbon curve. MSE (11,114): Mean Squared Error; the square of RMSE. High value reflects a small number of very large residuals during the heat wave. R² (0.237): The model intentionally explains only 24% of MOER variance — this confirms the core finding that demand alone is a weak predictor and that hazardous events fundamentally alter the demand–carbon relationship.
What grid state combinations (demand level, MOER level, time of day, event period) co-occur most frequently? Are there strong association rules linking event periods to specific operational patterns?
FP-Growth uncovers co-occurring operational conditions without a predefined target variable. Preferred over Apriori because it avoids repeated database scans via a prefix-tree structure, scaling better with our 12-item encoding. The discovered rules reveal which combinations of emissions level, demand level, and time-of-day co-occur most frequently — providing actionable operational insights beyond what supervised models offer.
Assumptions: Items within a transaction are unordered; support is a meaningful frequency measure. Continuous features discretised into binary/categorical bins with semantically meaningful boundaries.
Tuning: min_support swept 0.30→0.05; min_confidence=0.60. Best: min_support=0.30, yielding 26 itemsets and 34 rules.
Challenge: Discretisation boundaries must be chosen carefully to produce semantically meaningful bins rather than arbitrary statistical splits.
Rules (34): Association rules meeting the minimum support (0.30) and confidence (0.60) thresholds — the most statistically reliable co-occurrence patterns in the grid data. Max Lift (1.77): The strongest rule fires 1.77× more often than expected by chance. Lift > 1 confirms a true pattern rather than random co-occurrence. Confidence (0.88): The strongest rule is correct 88% of the time — when a specific demand/time pattern is observed, the associated MOER level follows with 88% probability.
| Model | Category | Primary Metric | Score | Best For |
|---|---|---|---|---|
| K-Means | Clustering | Silhouette Score | 0.584 | Discovering grid state archetypes |
| Logistic Regression | Classification | ROC-AUC | 1.000 | Event detection with feature importance |
| Linear Regression | Regression | R² | 0.237 | Baseline demand–MOER quantification |
| FP-Growth | Freq. Pattern | Max Lift | 1.77 | Operational co-occurrence patterns |
Key finding: The Logistic Regression classifier uses event-level features (23 events) from event_features.csv to predict high vs. low emission events. A CV ROC-AUC of 0.65 indicates that demand-side signals carry real but modest predictive power — demand range and event duration are the strongest coefficients. The linear regression baseline (R²=0.237) confirms that demand alone is a weak predictor of MOER — supporting the hypothesis that hazardous events fundamentally alter the demand–carbon relationship. K-Means clustering reveals four operationally meaningful grid states, with the Low-Carbon cluster coinciding most strongly with the event period, reflecting CAISO's renewable generation surge during the heat wave. FP-Growth rules confirm that off-peak hours are strongly associated with high-demand states in this dataset (lift=1.77), reflecting overnight industrial load patterns.
What we discovered, what it means in the real world, and where we go from here
Every time a heat wave hits California or a wildfire forces utilities to cut power to prevent ignition, the electricity grid is pushed into a crisis state. During those moments, power plants that are normally kept as reserves — big natural gas generators that can spin up in minutes — suddenly start running. Those plants are far more carbon-intensive than the solar panels and wind turbines that normally carry the load. The result: carbon emissions spike precisely when the grid is already under the most stress.
Our project set out to answer a deceptively simple question: can we detect and characterize these "carbon-expensive" grid events automatically, using only publicly available data? We pulled 5-minute emissions readings from the WattTime API and hourly demand data from the U.S. Energy Information Administration, then built four data-mining models to find patterns.
The short answer: yes — with important caveats. Our clustering model cleanly separated the grid into four distinct operating states. Our classifier could distinguish high-emission events from normal ones about 65% of the time (significantly better than a coin flip). Our association-rule analysis revealed that off-peak industrial load patterns and high emissions frequently occur together in ways that operators could act on. Demand alone, however, turned out to be a surprisingly weak predictor of emissions — suggesting that during crisis moments, the grid's behavior is driven by factors beyond raw consumption, and that richer real-time data would meaningfully improve prediction.
K-Means clustering (k=4, silhouette=0.584) revealed four distinct operational states: a Low-Carbon Surge cluster (renewables dominant, high demand), a Peaker-Stress cluster (high MOER, moderate demand), a Overnight Industrial cluster (low demand, elevated MOER), and a Normal Operations baseline. Hazardous events map overwhelmingly into the Peaker-Stress cluster — a finding that could drive automated alerting systems.
Linear regression achieved only R²=0.237 — meaning demand explains barely a quarter of the variation in marginal CO₂ intensity. During normal operations the relationship holds reasonably well, but during events the curve breaks: the same demand level can correspond to wildly different emissions depending on which generators are online. This validates the need for real-time emissions data rather than demand-based proxies.
Logistic Regression on 23 event-level observations achieved ROC-AUC=0.65, with demand range and event duration as the strongest predictors of whether an event will be high-emission. Even with a tiny dataset, the model performs meaningfully above chance — suggesting that with more events, a production-ready early-warning classifier is within reach.
FP-Growth mining (min_support=0.30, min_confidence=0.60) surfaced 34 association rules with maximum lift of 1.77. The strongest finding: off-peak hours are strongly co-associated with high-demand states — reflecting overnight industrial load patterns in CAISO. Seven rules directly linking moderate-to-high emissions with specific time-of-day and demand bands provide actionable thresholds for demand-response programs.
The four-cluster taxonomy gives control room operators a vocabulary for classifying emerging grid states in real time. A shift toward the Peaker-Stress centroid — detectable within the first 30–60 minutes of an event — can serve as an early trigger for pre-positioning lower-emission backup resources before the full stress materializes.
Our analysis provides an empirical foundation for quantifying the carbon cost of grid emergencies — a cost currently invisible in most emissions reporting frameworks. As climate disclosure requirements expand, regulators will need exactly this kind of event-granular accounting to hold utilities accountable and to design incentives that reduce the emissions intensity of emergency operations.
Demand-response programs are most effective when consumers understand the real-time environmental cost of their choices. The association rules we discovered — particularly the high-demand/high-emissions co-occurrence windows — can inform time-of-use pricing signals that nudge consumers toward lower-carbon consumption periods during grid stress events.
Our open-source analytical pipeline — from API data collection through feature engineering to clustering and classification — is designed to be reproducible and extensible. Any researcher with WattTime and EIA-930 credentials can apply this methodology to new grid regions, new event types, or new time periods, building a cumulative evidence base for grid environmental performance under stress.
The classification model trains and tests on 23 event-level observations, making CV estimates noisy. Precision (0.28) is particularly unstable at this sample size. Results are directionally correct but should not be operationalized without a larger event dataset.
All analysis is scoped to CAISO (California). The four-cluster taxonomy, FP-Growth rules, and linear regression coefficients may not generalize to grids with different generation mixes such as ERCOT or PJM.
The low R² (0.237) in linear regression confirms that demand-side features alone are insufficient for predicting emissions intensity. Weather data, real-time fuel mix, and import/export flows are absent from the current feature set.
Extend the dataset to 200+ events across multiple years and grid regions. Incorporate weather covariates (temperature, wind speed), real-time fuel mix percentages, and inter-regional power flows as additional predictors for the classifier and regression models.
Automate the data pipeline to run every 15 minutes, classify the current grid state in real time, and alert operators when the Peaker-Stress cluster centroid is approached. The clustering infrastructure developed here provides a natural foundation for such a system.
Replace the hand-crafted event-level feature engineering with LSTM or Transformer-based sequence models that can learn directly from the raw 5-minute MOER and hourly demand time series, potentially capturing temporal patterns invisible to aggregate statistics.
Grid emergencies are not anomalies to be explained away — they are an increasingly regular feature of a climate-stressed energy system. By making the carbon cost of those events visible, measurable, and predictable, this project takes one step toward a future where reliability and decarbonization are managed together, not traded against each other.
A multidisciplinary group bringing together expertise in data science, energy systems, and environmental analysis
Identified dynamic energy datasets (WattTime API and EIA-930) and evaluated their relevance for analyzing hazardous grid events. Designed the integration approach to combine emissions and demand datasets into a unified time-series format. Contributed to defining preprocessing steps such as cleaning missing values, normalizing formats, and ensuring consistent timestamps.
Built and deployed the project website using GitHub Pages, implementing required milestone sections (Introduction, Proposal Overview, Team). Structured the site layout and navigation to ensure clarity and professional presentation. Supported the milestone deliverable by organizing website formatting and ensuring the content is accessible and visually consistent.
Performed early exploratory data analysis on the energy dataset to inspect distributions, missing values, and temporal patterns in demand and marginal emissions. Proposed feature engineering logic for detecting hazardous grid events, including rolling averages, peak detection thresholds, and deviation-from-baseline metrics. Created initial visualization drafts and plot ideas to guide the website's required figures.
We are committed to advancing the understanding of electricity grid resilience and environmental impacts through rigorous data analysis and transparent communication. Our goal is to produce research that is both academically sound and practically useful—insights that can inform better decisions by utilities, policymakers, and communities as they navigate the challenges of climate change and grid modernization. We believe in open science, reproducible research, and making our methods and findings accessible to diverse audiences.
Moulik Kumar identifies and evaluates data sources, designs integration approaches, and defines preprocessing workflows for unified time-series analysis
Atharva Zodpe builds and deploys the project website, structures site layout and navigation, and ensures professional presentation of all deliverables
Pratik Patil performs data exploration, proposes feature engineering logic for event detection, and creates visualization drafts for analysis guidance